Impact
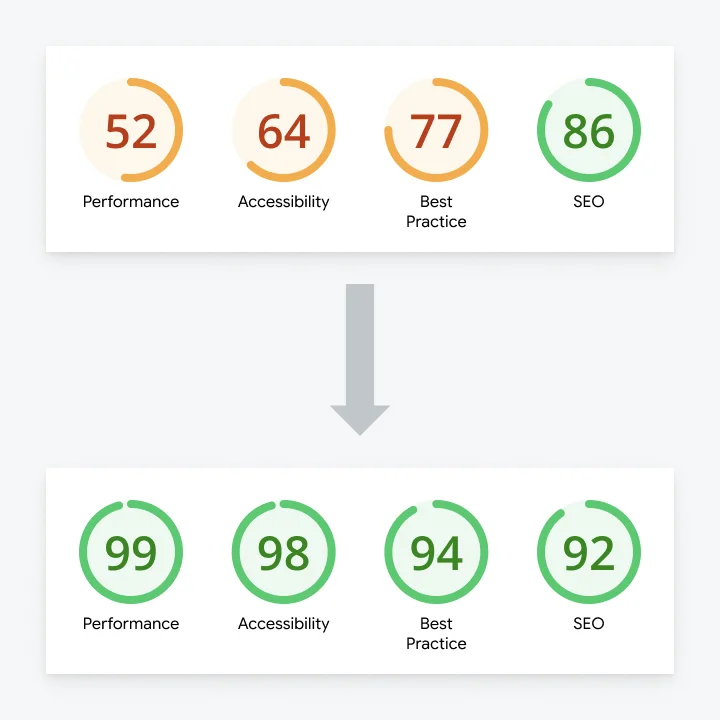
96
Average PSI score
+48%
Performance & accessibility improvement
+473
SEO position ranking
Overview
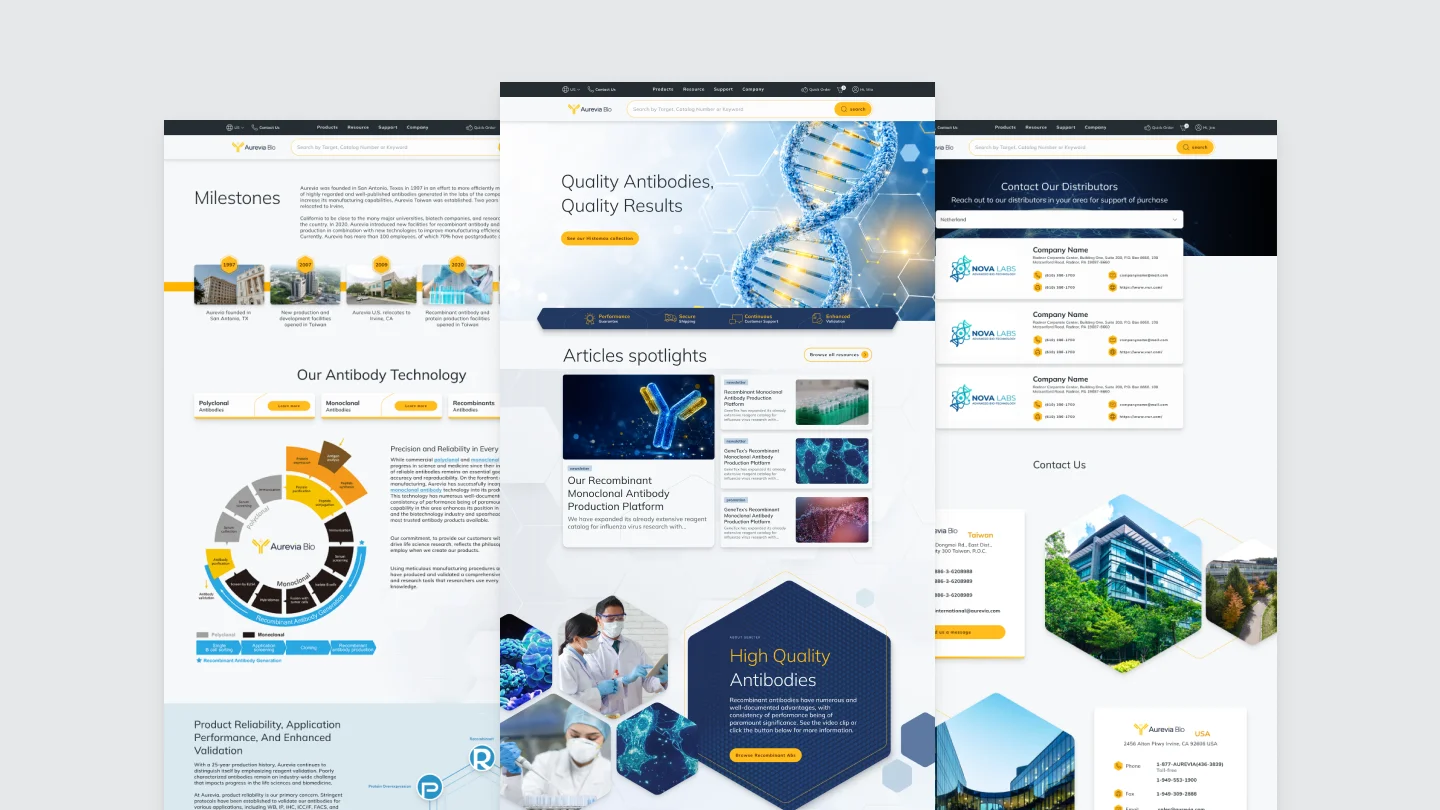
A full brand revision and website update has been done for this project.
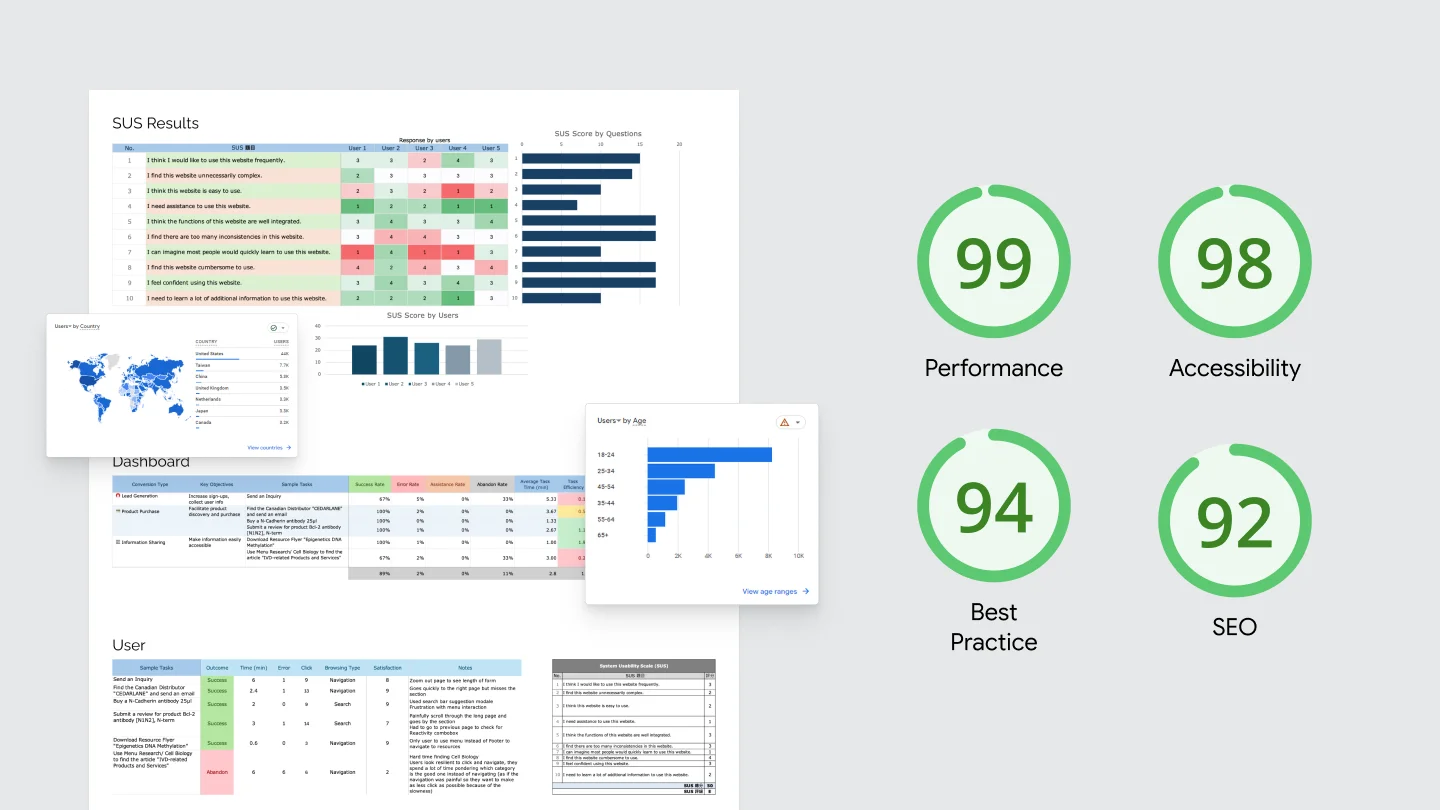
With a developer's technical research feeding into it, I combined a usability test with that knowledge to not only improve the user experience but also boost the overall website PageSpeed score.
Brief
The client wanted a faster, more accessible site
The website was complex as it combined an e-commerce platform with academic articles, so the redesign had to balance dense scientific information with reading comfort.
However, to make the client feel that their investment was worth it, we needed to create something visually striking without breaking the site's original purpose.
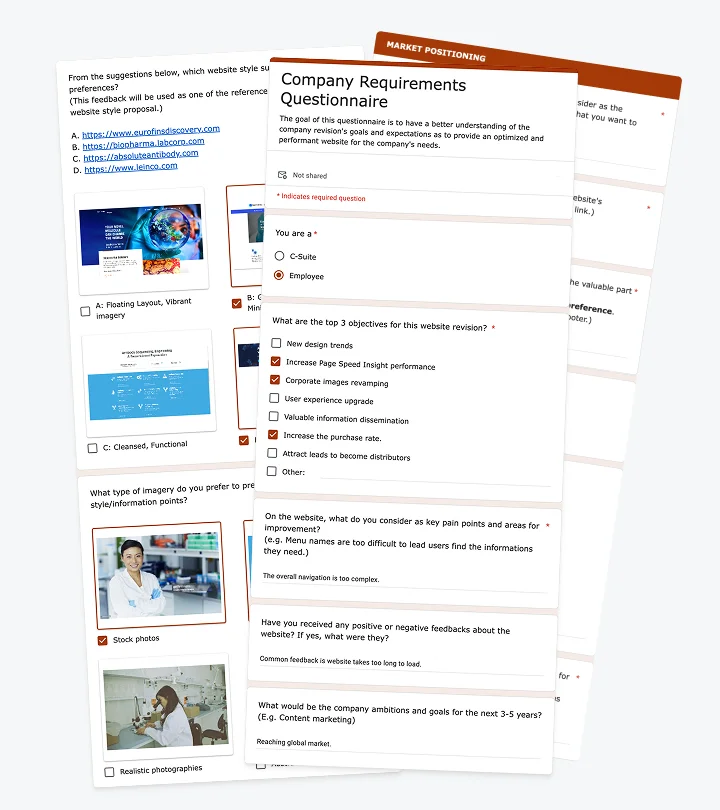
What did the client actually need to fix first?
I collaborated with my manager and the project manager to build a survey sent to 25 employees and executives to get feedback on the company’s goals, pain points, competitive positioning, and visual direction.
Three priorities came out on top:
Make purchasing easier
Make article content accessible
Generate more leads
Testing
I built a usability test around those three priorities
The client worked in a scientific field, so a data-driven approach felt necessary to ease decision making.
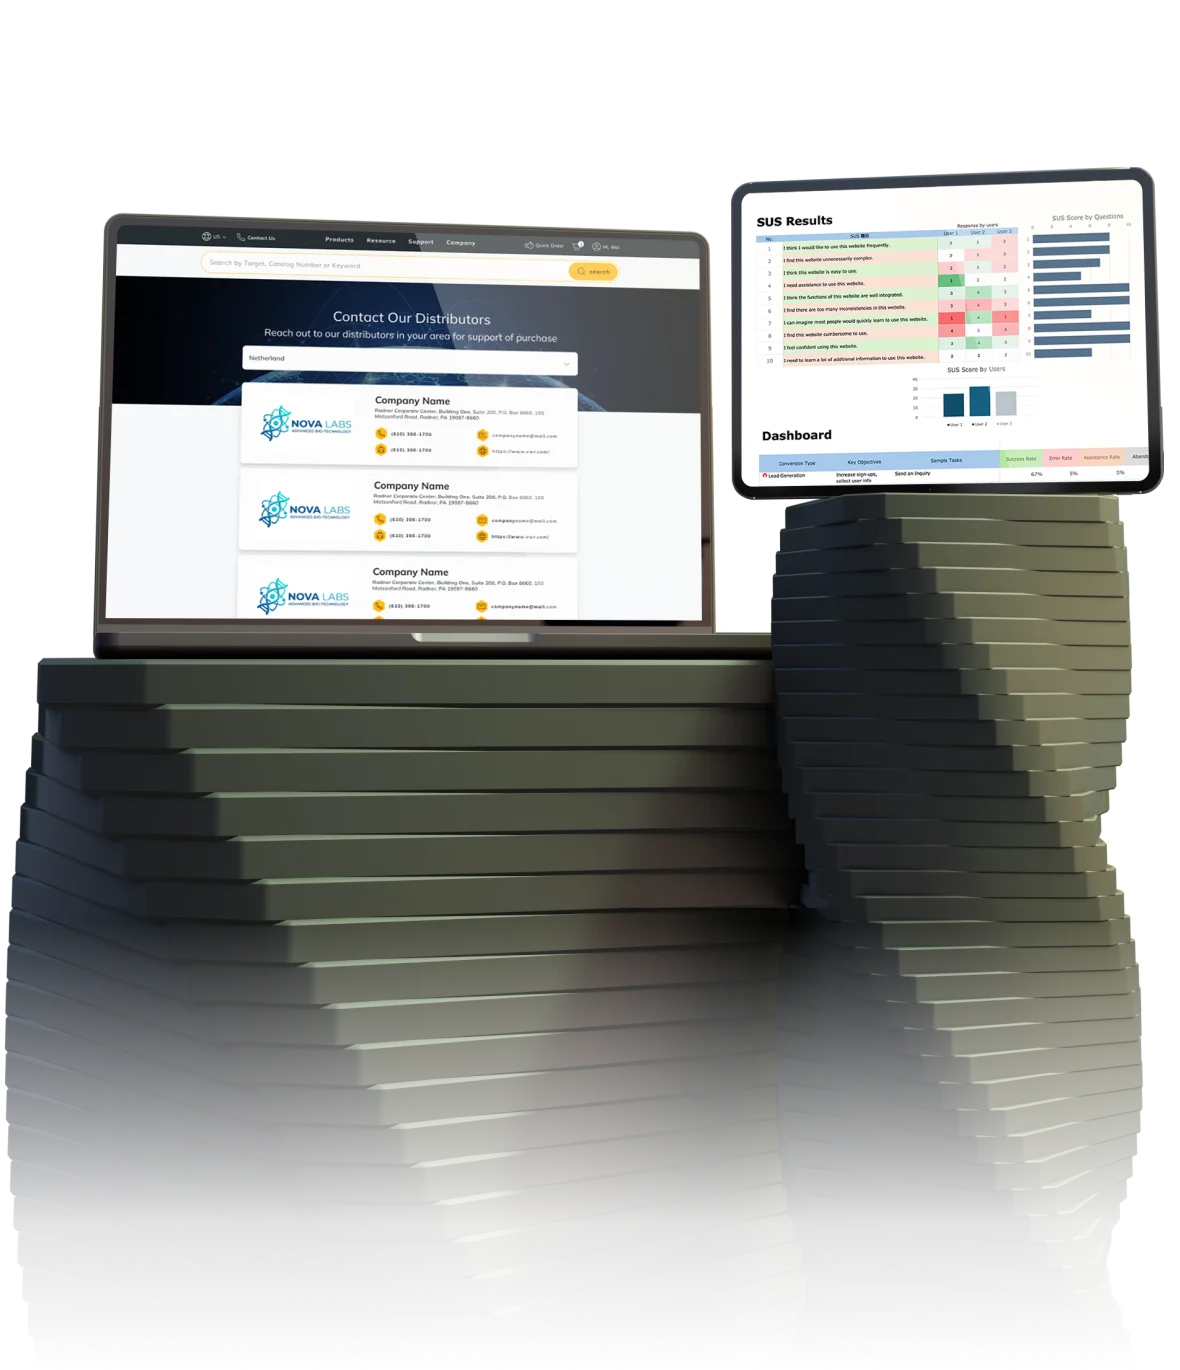
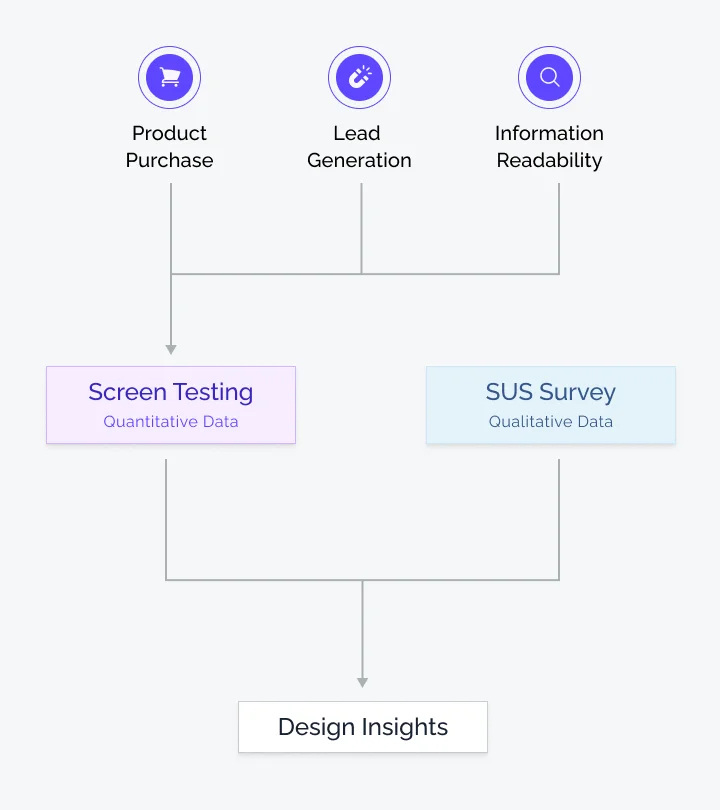
I scoped the test around the three priorities: purchase, information sharing, and lead generation. I combined task scenarios with a System Usability Scale (SUS) to capture both quantitative and qualitative data.
Five user sessions were enough to notice the majority of usability issues. It gave me useful information such as completion rate, time on task, and subjective satisfaction for each task.
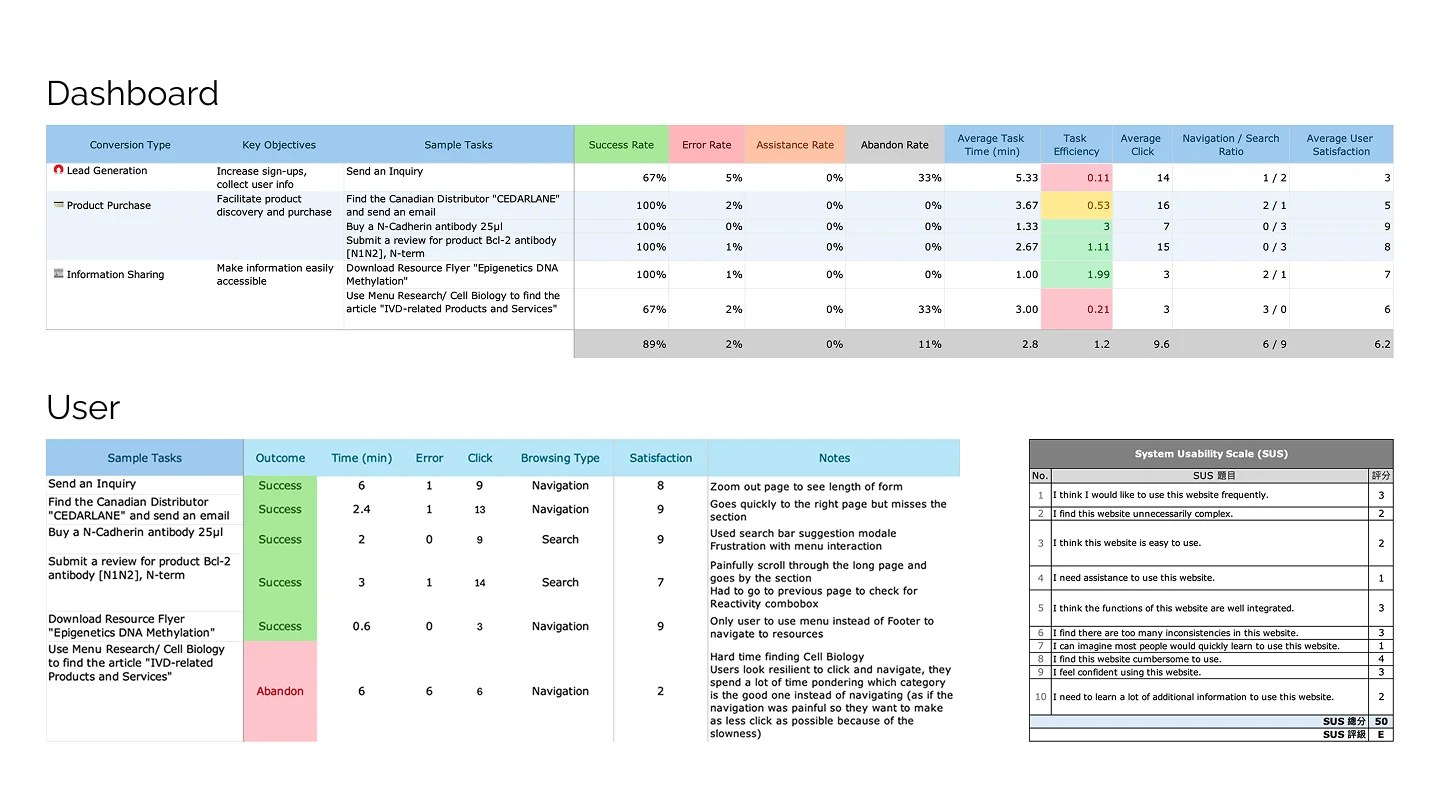
User data was individually collected and then gathered in a global dashboard to better observe the trends.
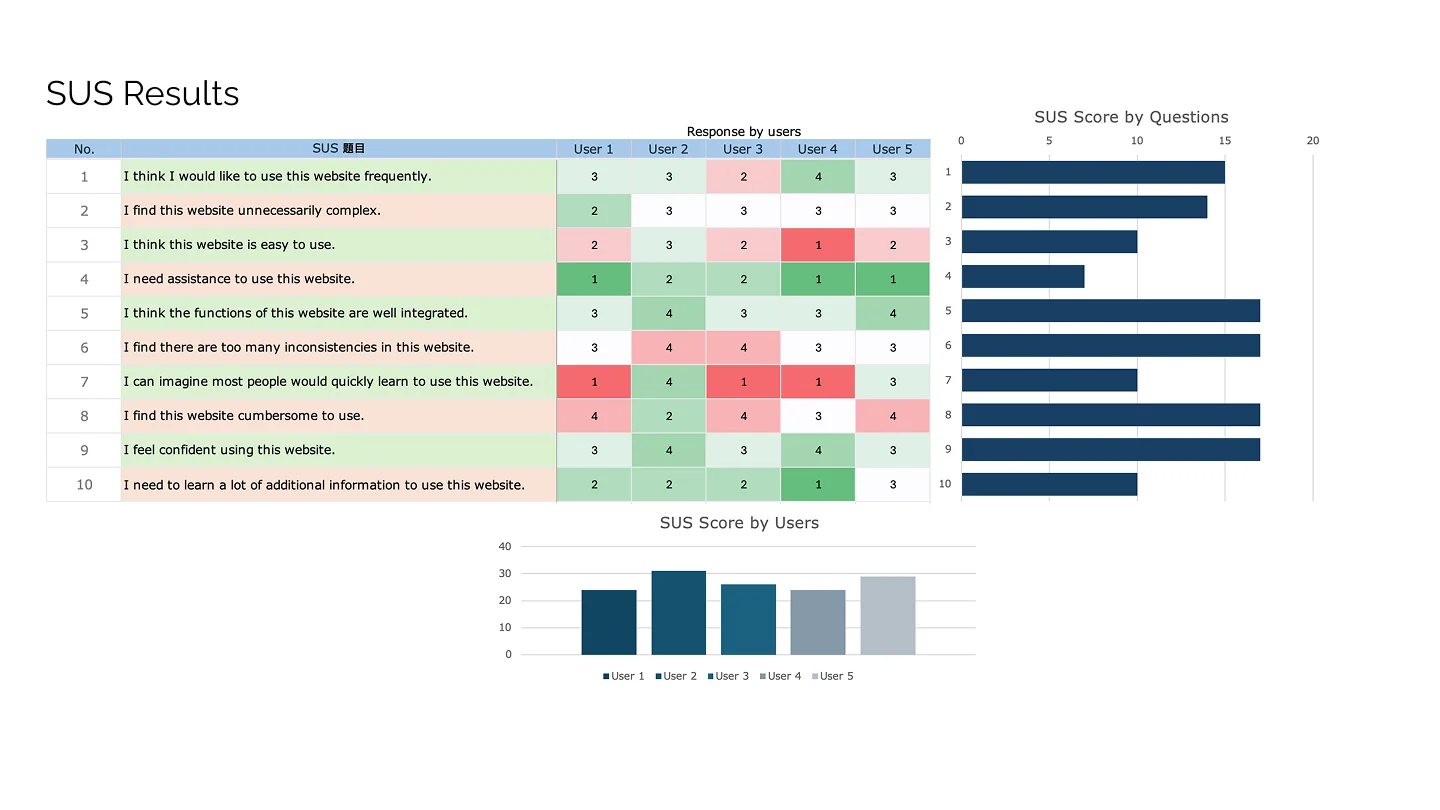
Each user was also asked to fill a System Usability Scale (SUS) to better assess qualitative data such as subjective response.
Buying was fine. Everything else wasn't
Purchasing was relatively efficient, though click count was higher than it should be. The real problem sat in the secondary goals such as article search and lead generation as they saw significant abandonment.
The SUS results pointed out that the site felt unnecessarily complex to navigate, even though reading quality got positive feedback.
100%
Of users found the right product
3min
Spent per tasks in average
33%
Of users were unable to send an inquiry
Analysis
I organized every finding into six categories
Each observation, from SUS sentiment to task data and video-based behavior patterns, was paired with a potential design fix. I also highlighted the points that would have the most impact on the user experience or would require heavy work design-wise.
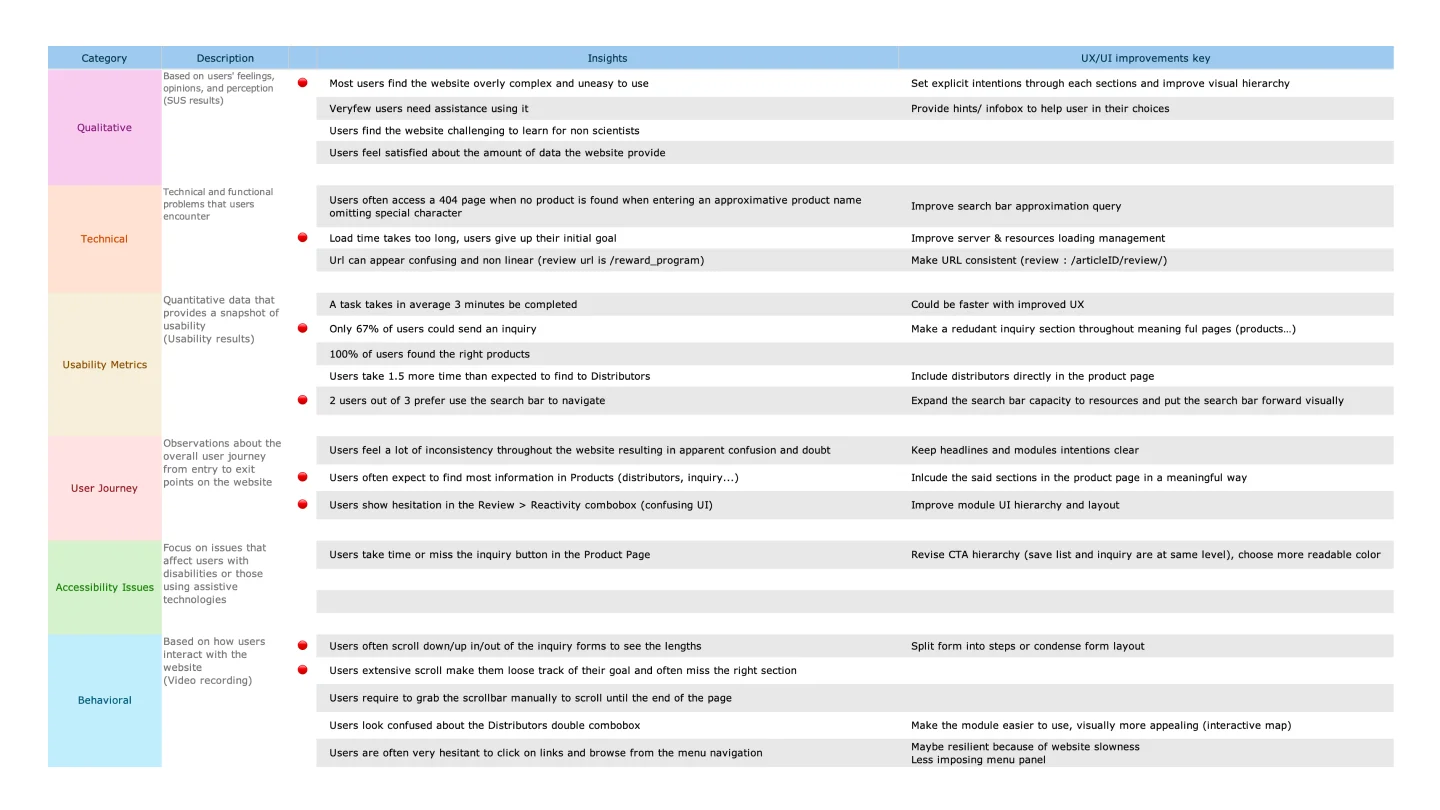
Each observation was segmented by type and paired with a visual or user-experience improvement.
Stakeholders needed to see visual results, not insights
The project manager suggested to pair every insight with an actual design so the impact was obvious for the client.
I filtered the findings according to what mattered most to the client's priorities, and matched each one to a concrete design change.
I also considered accessibility improvements in the new design system including new typography scale or enhanced color contrast.
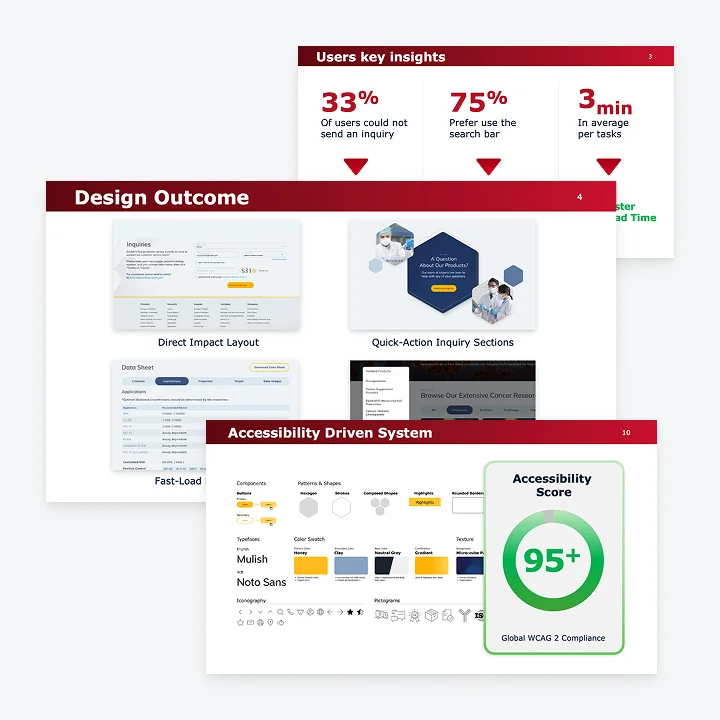
Resolution
The client didn't trust user sessions as proof
Instead, the PM and I decided to use a second lever to drive decision-making: the PageSpeed Insights (PSI) report, which we knew the client would trust.
Showing how specific choices like undersized text or weak color contrast would hurt the overall score helped prevent further accessibility or navigation issues.
Every round of feedback multiplied into more back-and-forth
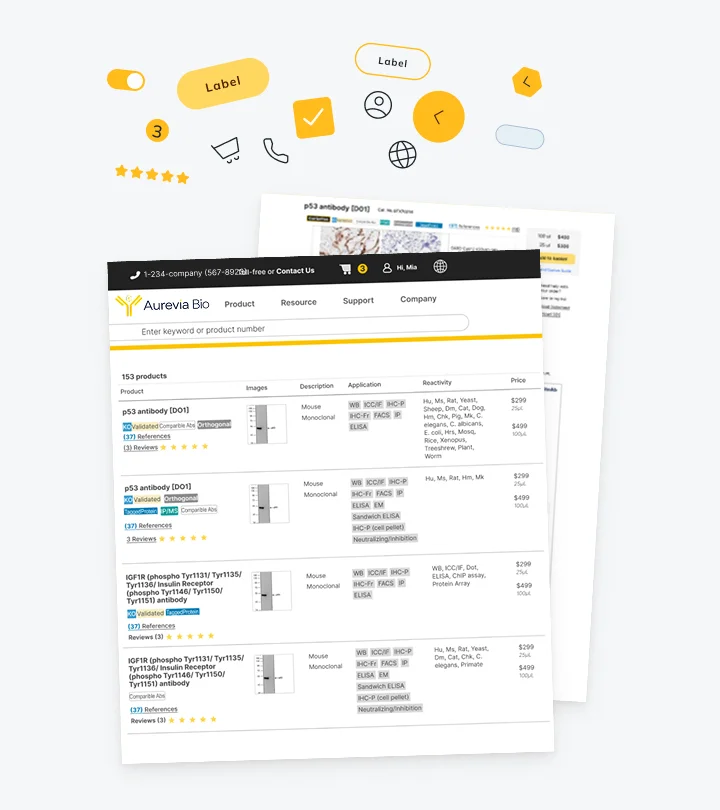
To answer this, the PM and I decided to give them static snapshots of the design system components, buttons, tabs, or cards.
The provided kit allowed client to assemble the exact layout they had in mind and work with concrete visual rather than speculations.
The revision rounds dropped from 8 to 2.
Client wanted to stay classic, but the data said otherwise
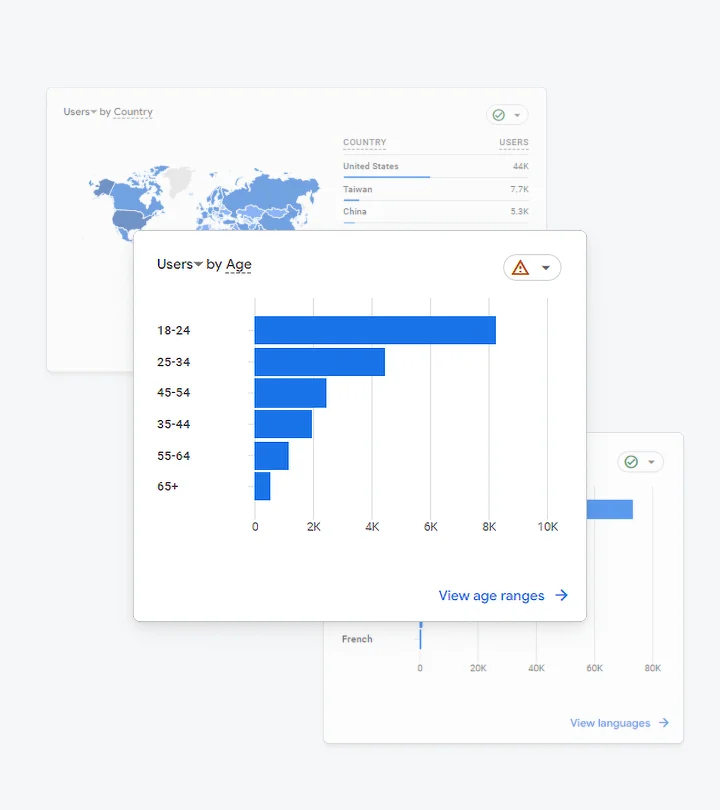
Among the two proposed indexes, the client leaned toward the safer and classic option; but working with the project manager, we convinced them to go for the bolder direction instead by using the data from GA4 as the main argument.
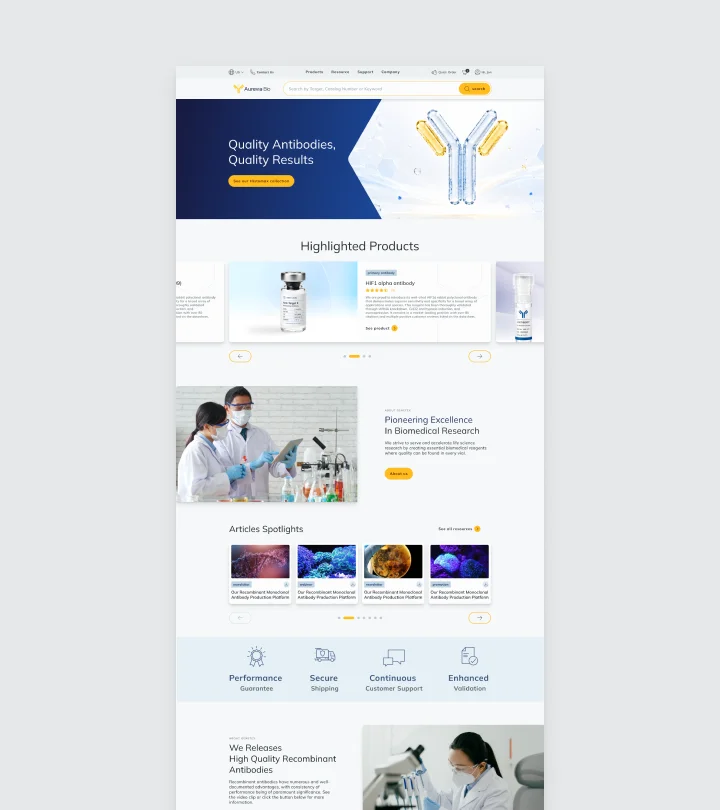
The first index was pretty safe regarding client's industry, however it lacked clear brand positioning.
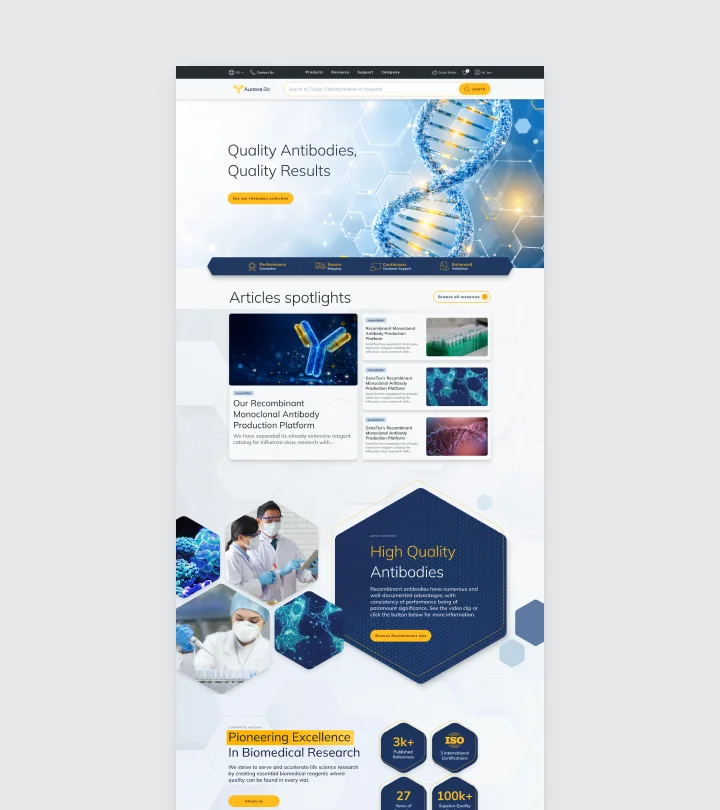
The second index was designed with client's main demography in mind and with ambition to better compete with competitors from that area.
Results
The improvements opened the door to a second phase
Although not all proposed improvements were approved, I implemented the fixes that aligned with the client's initial priorities. By providing the client with a design kit, we accelerated decision-making and delivered the project on time. The client satisfaction led to a second phase that included changes related to the product flow.
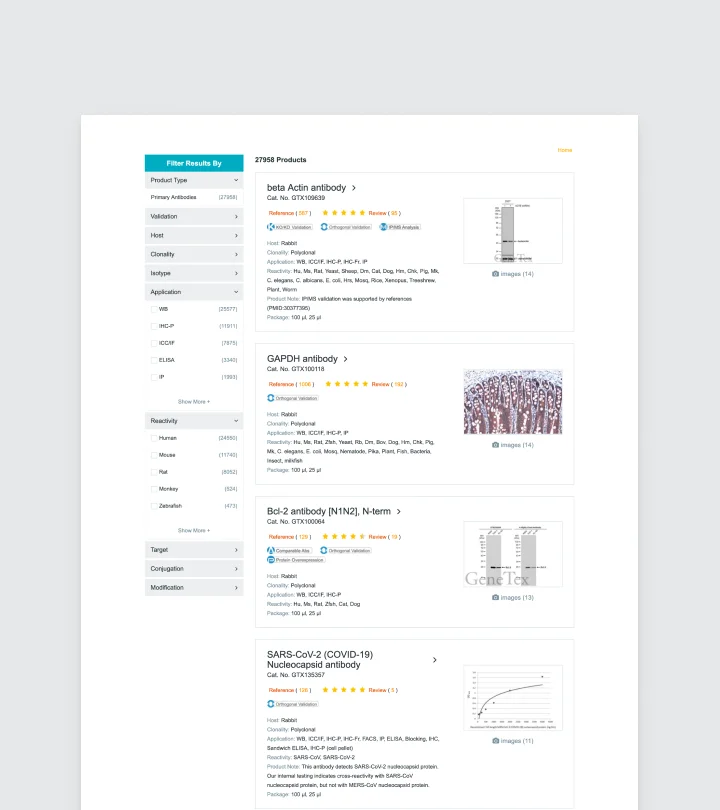
Before users had to scroll through a side panel to filter products.
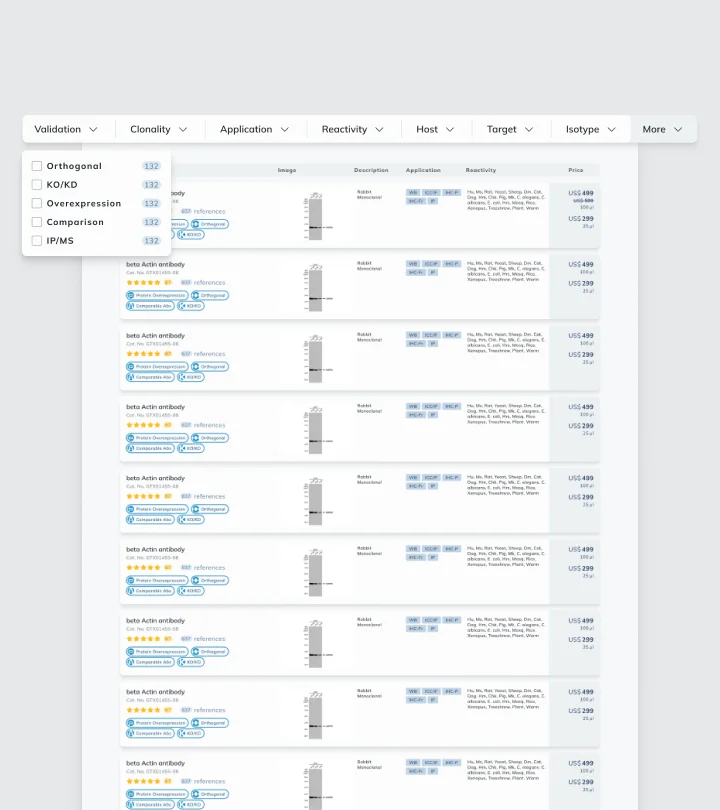
After, I decided to add a horizontal sticky menu so users have access to filters at all times.
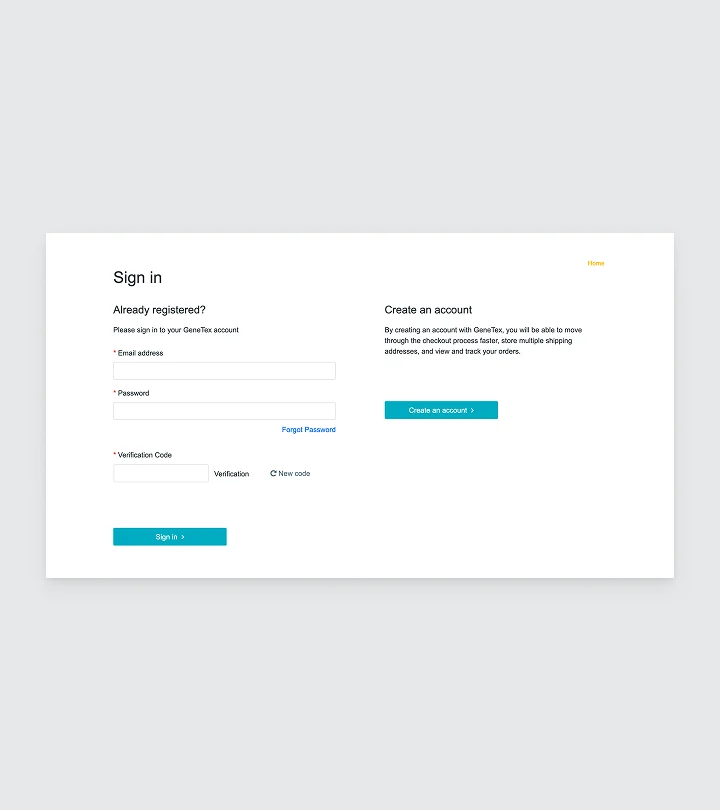
Initially the sign-in page lacked instruction and benefits on why users should create accounts.
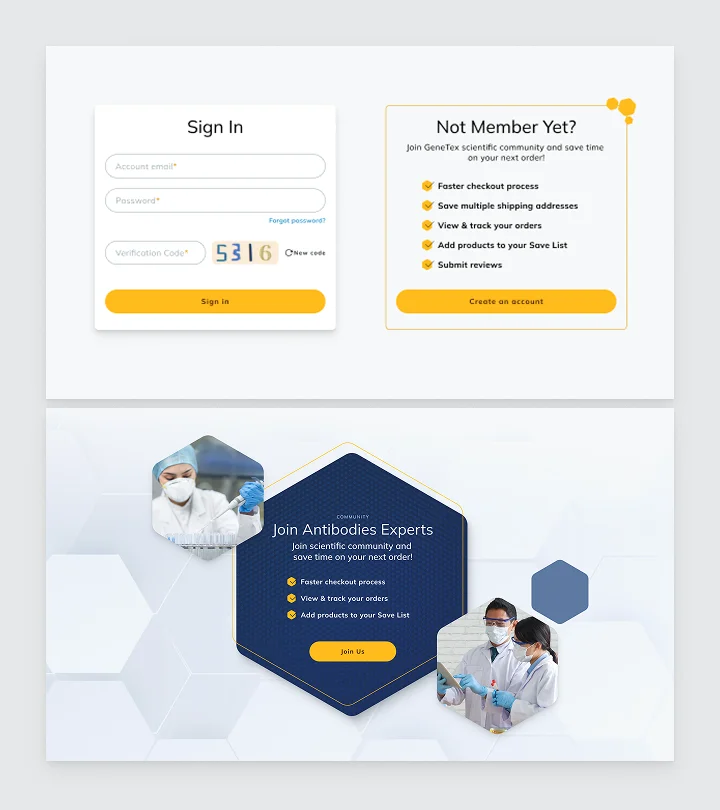
To encourage account creation, I improved the overall page layout with a more marketing approach and added lead magnets across the website.
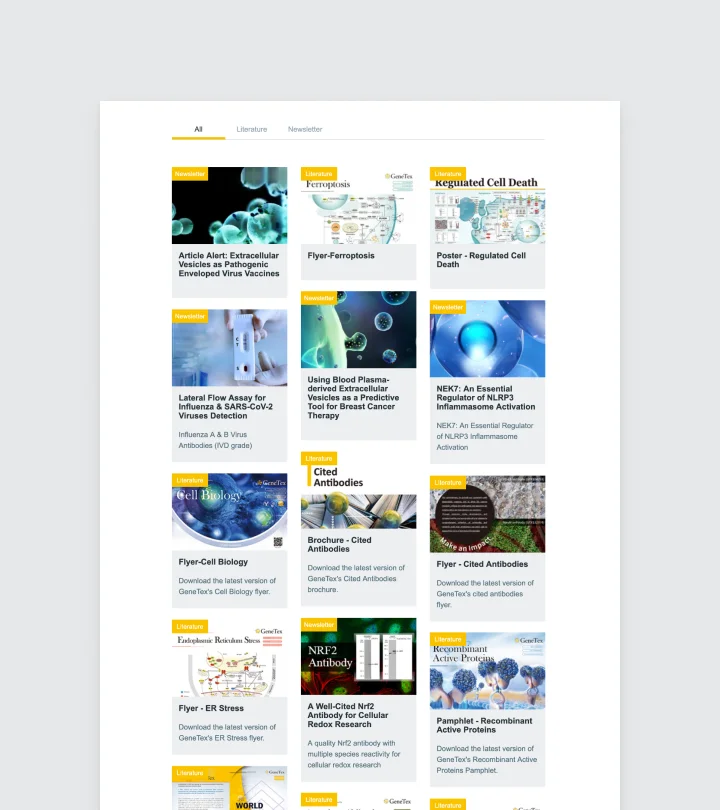
On the previous version, news and downloadable resources were gathered under a common tab navigation.
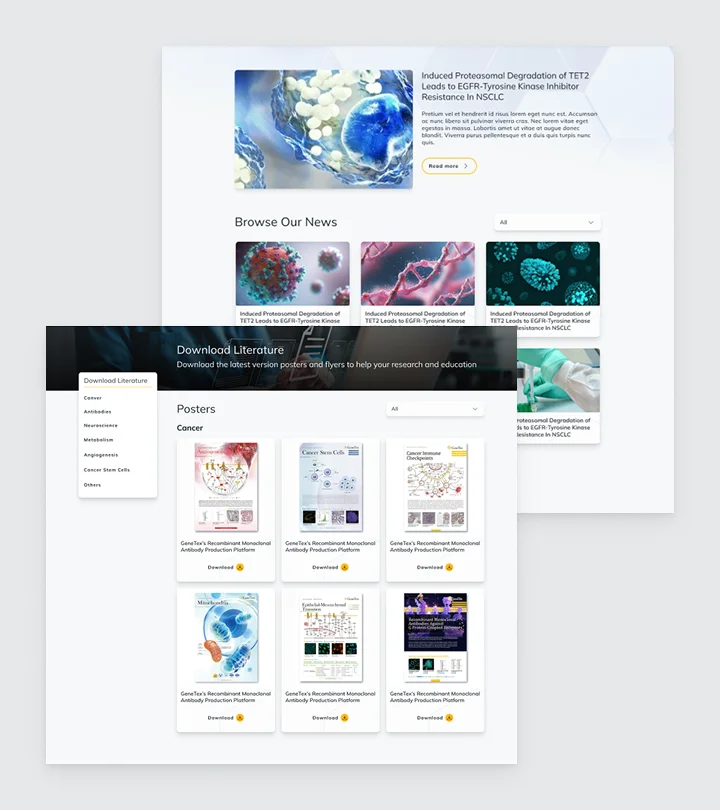
I decided to split them into two distinct units so it's clearer for users to understand each page's intent.
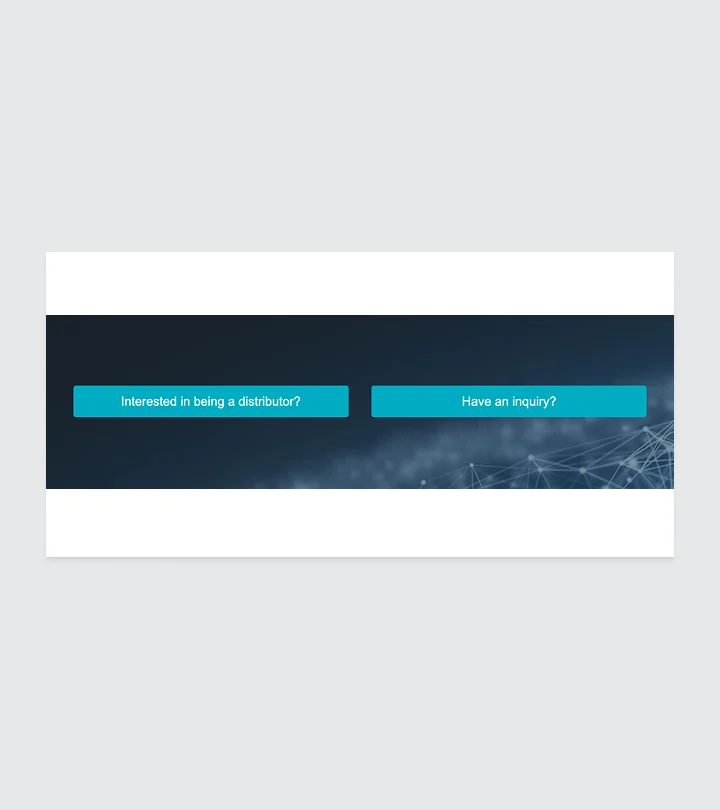
Initially the inquiry only had one small touch point in the About unit.
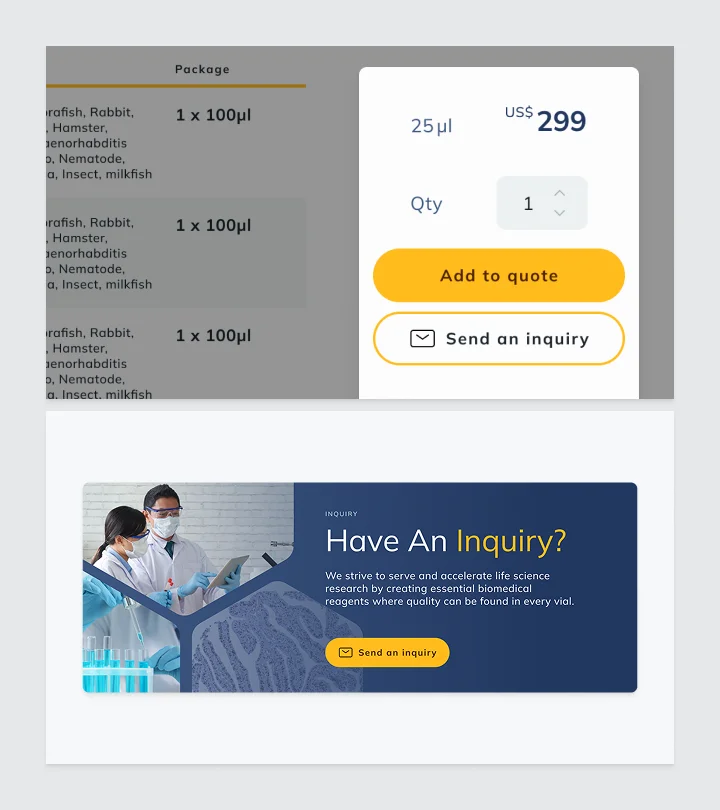
I decided to multiply the touch points and add eye-catching modules throughout the website in various forms.
Learning
Automate user behavior analysis
Behavioral data was hand-logged from session recordings. It was accurate, but used three days of work for five users.
For future tests, I would provide automated tracking tools so quantitative data comes out more quickly and accurately.
Challenge decisions that we knew wouldn't grow
We let the client steer toward a layout that looked right short-term but wasn't scalable, and phase two is now patching around it.
Since then, I introduced a version system so future adjustments build on the structure instead of overwriting it.
Flag the unproductive feedback pace earlier
Revisions came in unpredictably, one-off change a day, large batches the next, which harmed the design system's scalability over time.
I now set explicit feedback-cadence expectations with the PM upfront.